Address-precise
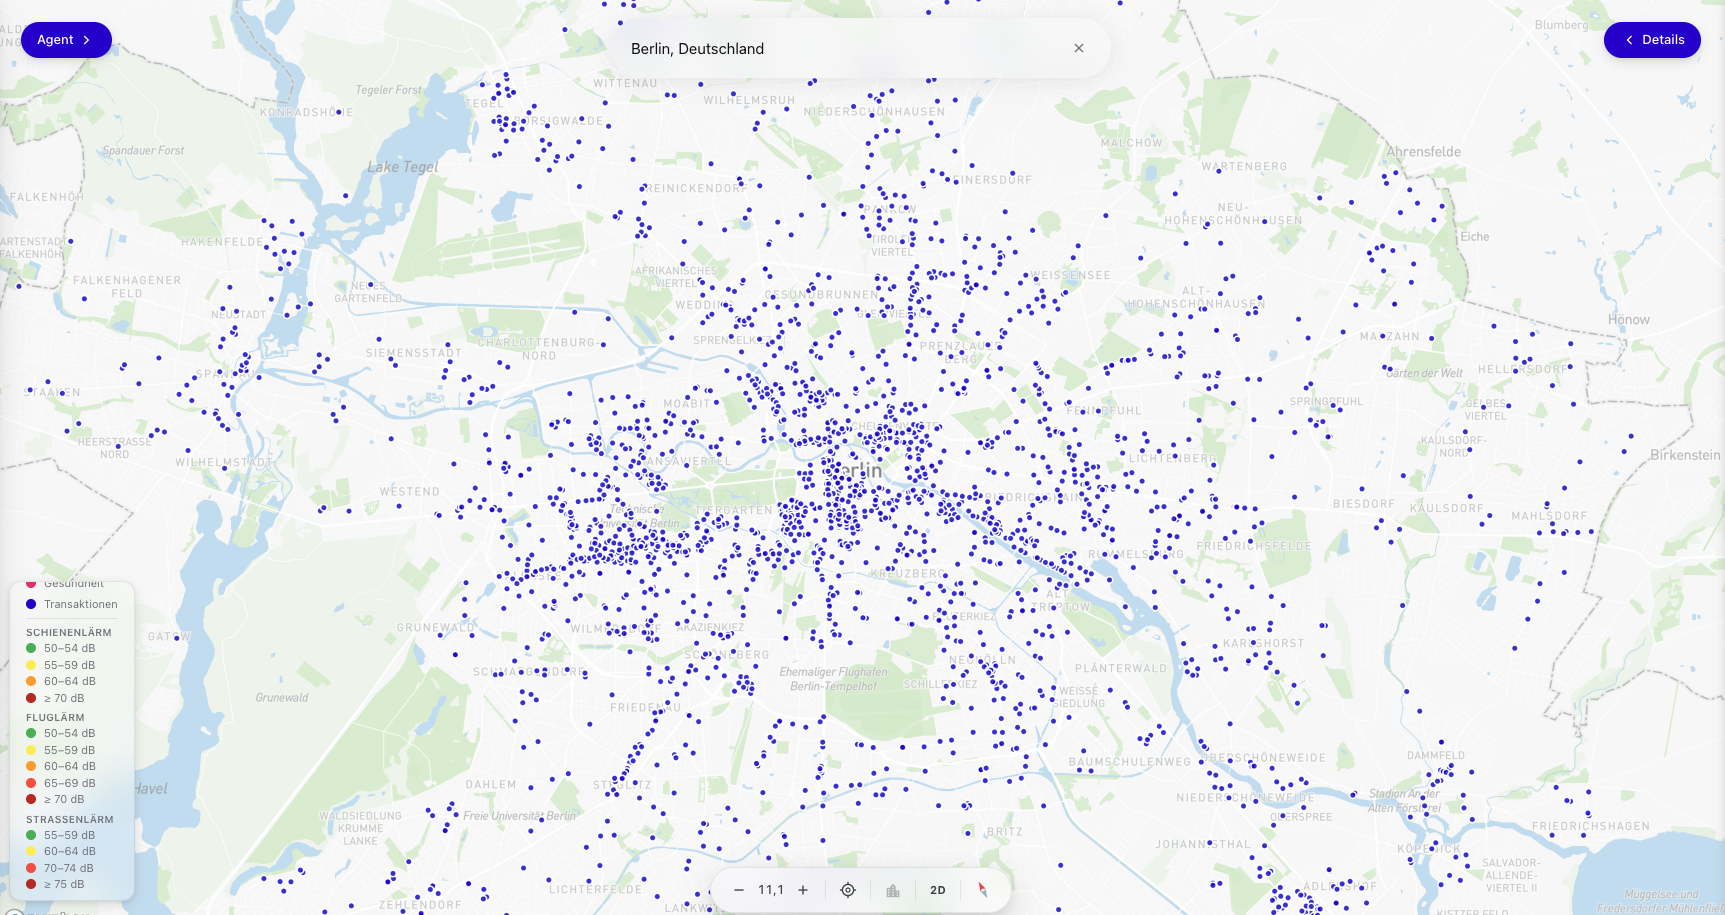
Pinpoint accuracy for every location across Germany. Click the map, get a full market picture for that exact spot.
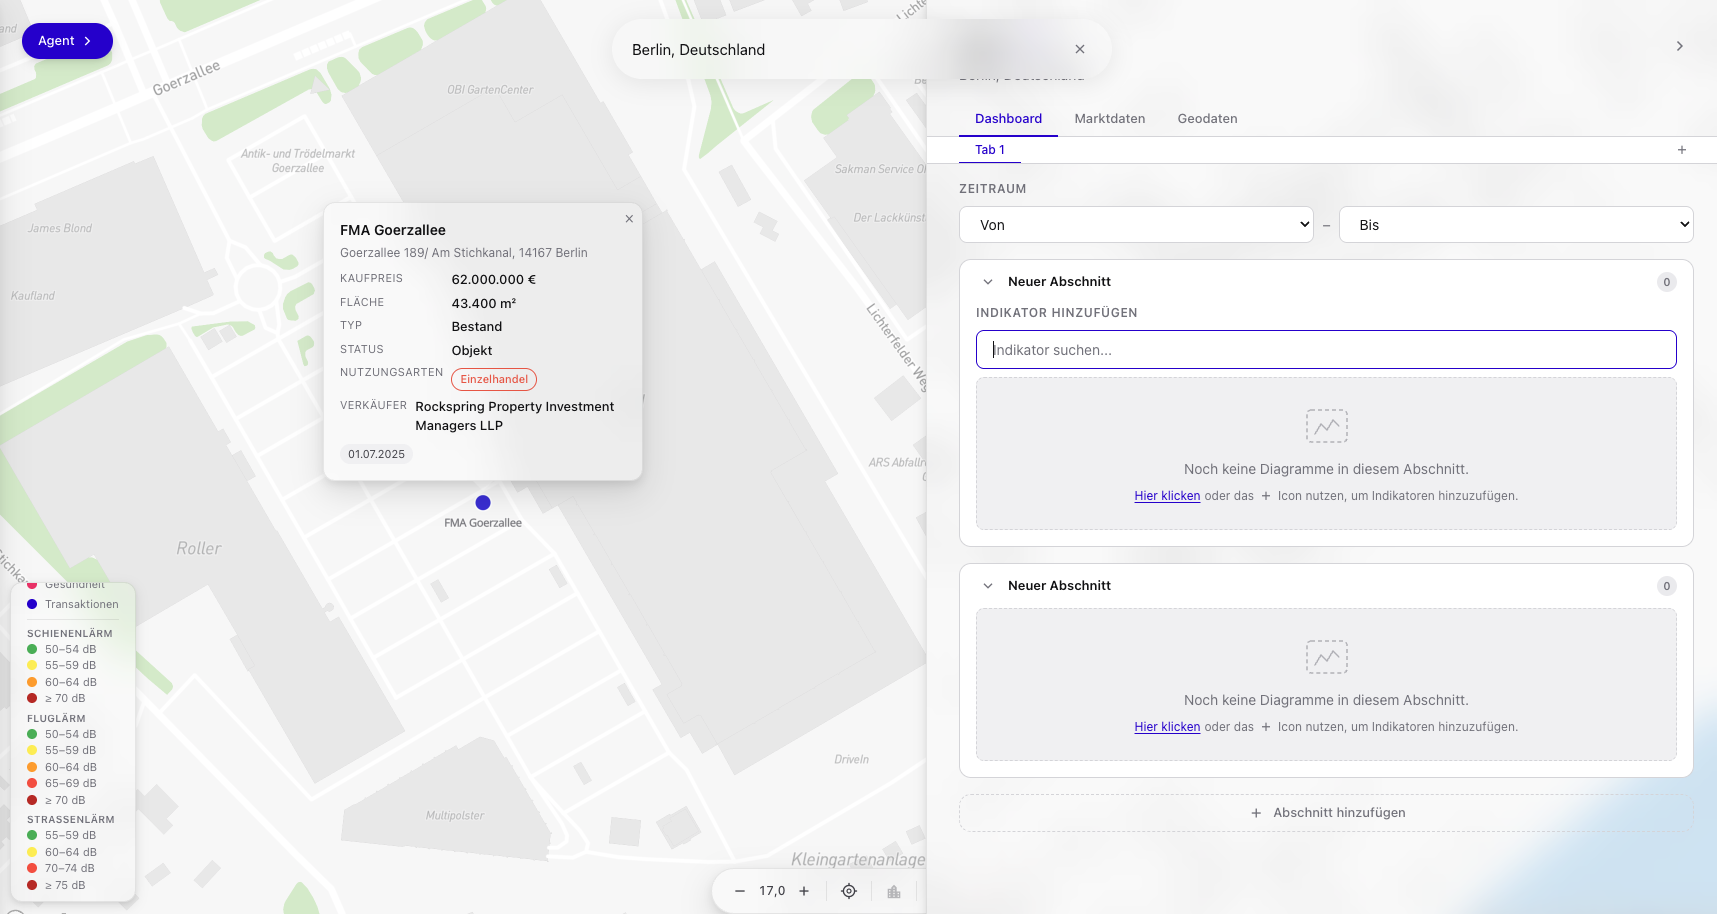
Enter an address. See the market picture. Generate a valuation draft. Address-precise data from RIWIS, Oxford Economics and Value AG — unified, not placed side by side.
Built for regulated institutions

The status quo
Countless tools. Many portals. One tedious process.
Rents from one portal, forecasts from a second, standard land values from a third, location criteria from a fourth. The analysis begins with collecting — and ends with the worry that the numbers are already out of date.
A map-centric workspace that brings RIWIS, Oxford Economics and Value AG into a consistent, comparable market picture — address-precise, across the whole of Germany.
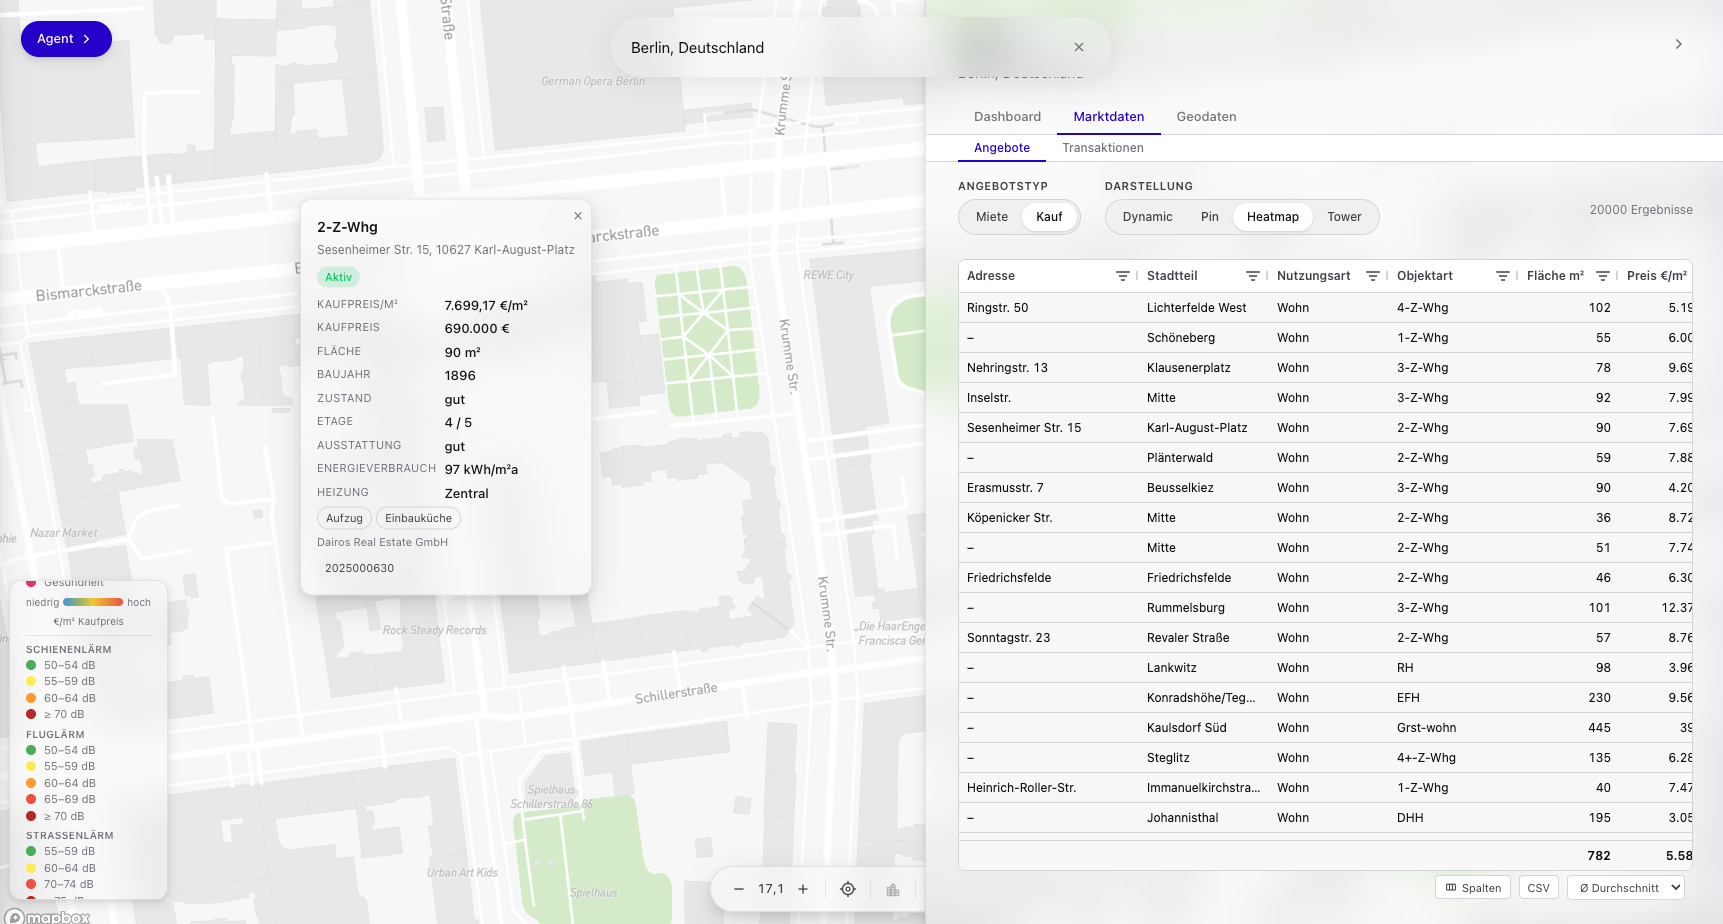
Enter an address or click on the map. Rents, transactions, pipeline, standard land values, demographics, location quality and macro forecast appear in a configurable dashboard. Normalised across providers, not placed side by side.
Address-precise data. Multiple sources, normalised. One view across the whole market.
Pinpoint accuracy for every location across Germany. Click the map, get a full market picture for that exact spot.
RIWIS, Oxford Economics, Value AG and more — normalised into one comparable model, not just placed side by side.
Dashboard, map and natural-language answers all run on the same data basis. No portal-hopping.
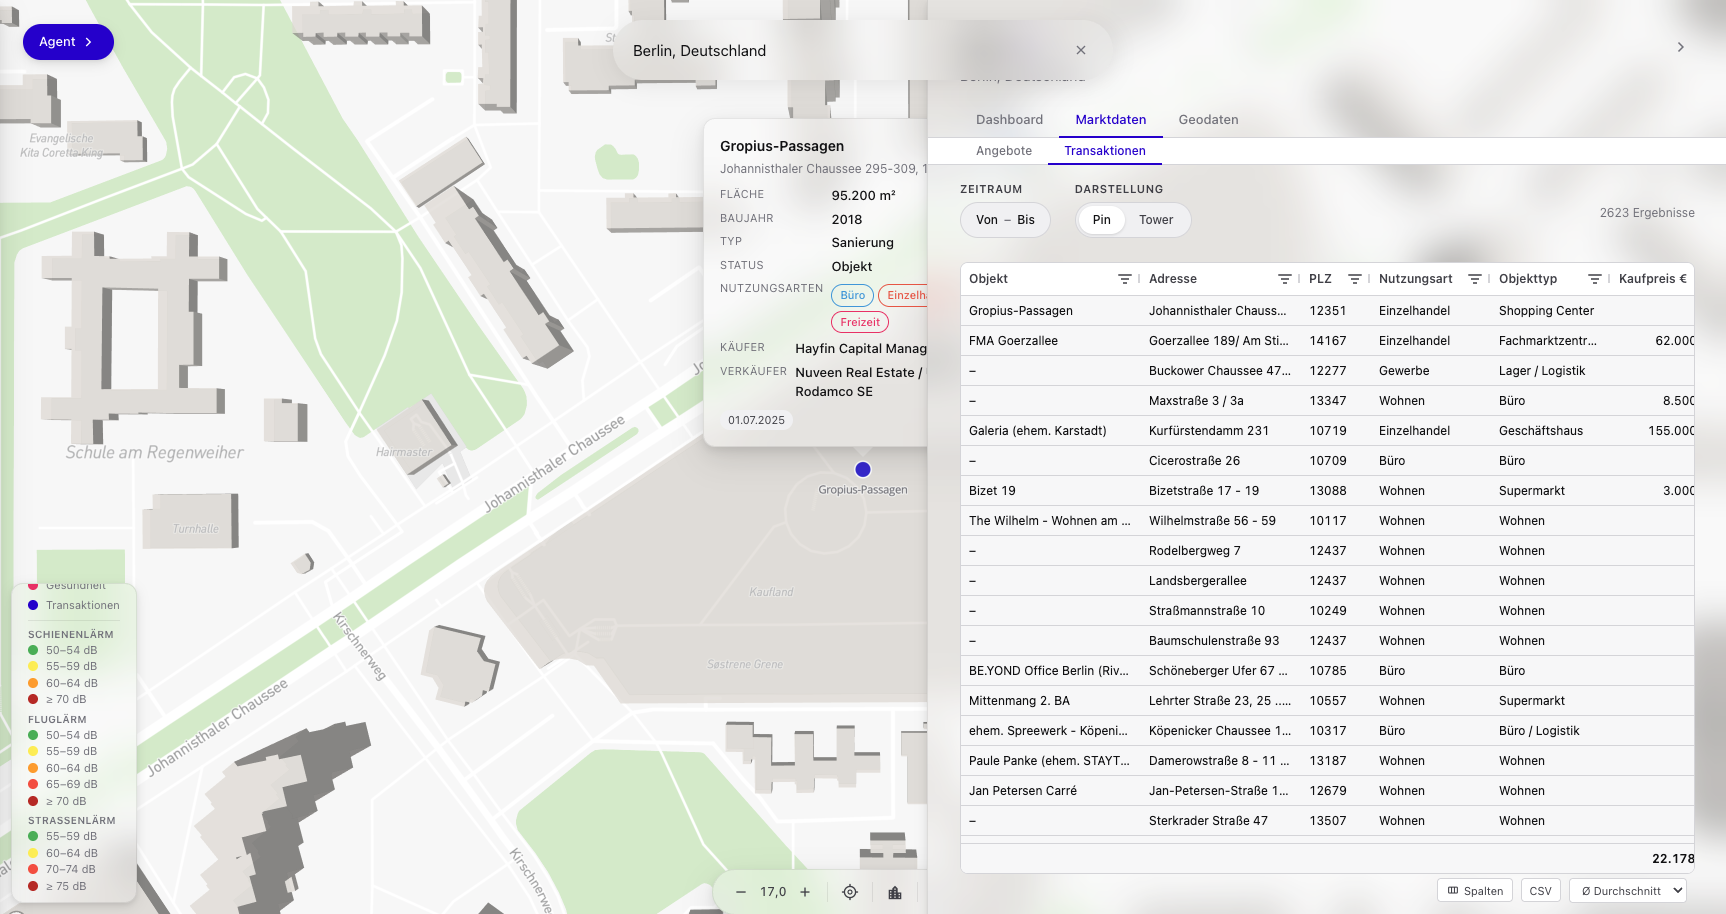
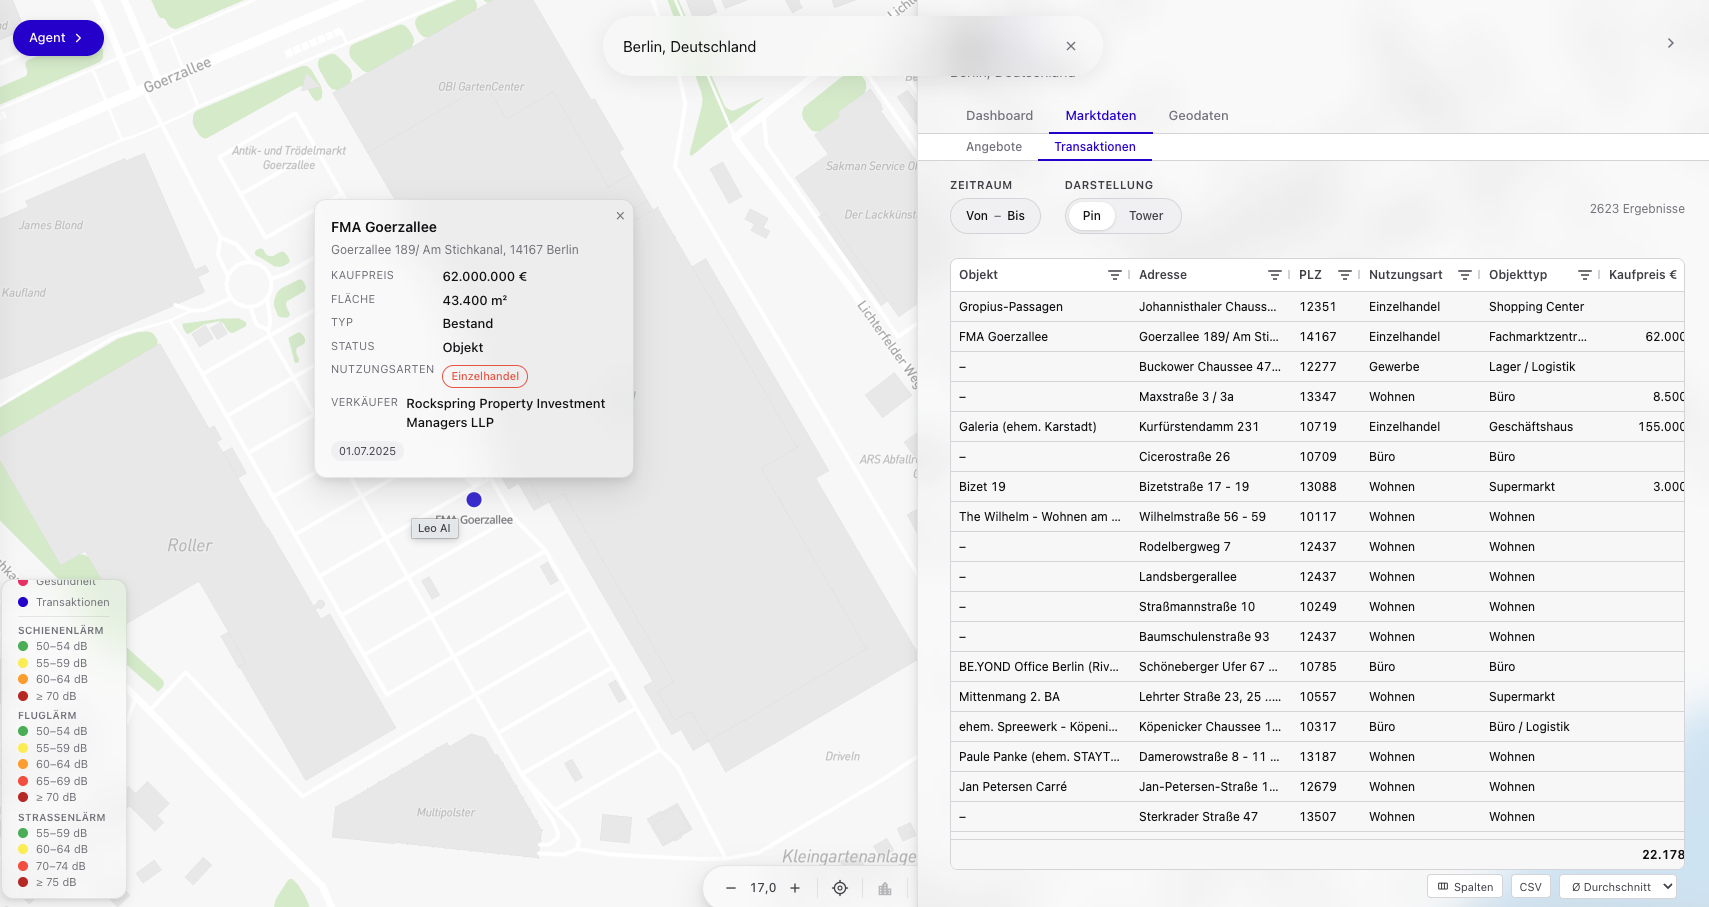
Rents, yields, vacancies, transaction prices per asset class — Office, Retail, Hotel, Residential, Logistics. Plus macro forecasts and scenario analyses. All in a consistent model, directly comparable.
Location becomes measurable. Isochrones on foot, by bike or by car. POI analysis, risk layers for noise, flooding, listed-building status. Micro and macro location built from structured indicators — not from gut feeling.
Asset value, income value, comparative value — in line with ImmoWertV, BelWertV and HypZert standards. atlas provides structure from property intake through to chapter-by-chapter generation. The appraiser keeps authority, atlas takes over the recurring text work.
From the question comes an outline, from the outline a finished report — based on the data visible in the dashboard. Corporate design, editable building blocks, traceable sources. Hours become minutes.
Lay your own holdings over the market. Geographic concentration, vacancy exposure, pipeline pressure, deviation of actual rents from the market band. Risks become visible before they show up in quarterly reporting.
Market value plausibility checks, location scoring, concentration analysis. Credit-committee context in minutes, with sources and timestamps.
Pitch material at broker quality. Feasibility, competitive analysis, multi-criteria location comparison — exportable in your own corporate design.
Comparative values, market adjustment coefficients, automated market context. A structured draft partner — judgement stays with the appraiser.
Portfolio benchmarking, acquisition screening, scenario analysis on macro forecasts. One data basis for the whole team.
atlas delivers the market context for every address. argus delivers who stands behind a company. Together: a picture of the beneficial owner and their market in a single piece of research. Alongside atrium, atlas is the market data layer for the entire credit process — financing assets pull market context directly from atlas.
The unifying layer
The German CRE data market is first-class but fragmented. atlas is the layer that connects it.
Built for regulated institutions
Inference via European endpoints, no training use on customer data, full audit logs. Security is built in, not bolted on.
See atlas at one of your own addresses. Live demo at a location of your choice — including the procedures that run in your house every day.